Skip to content
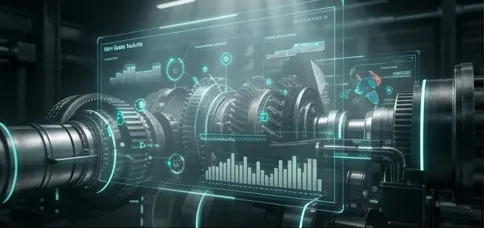
A cutaway of an industrial turbine with its sensors mapped

Solutions · what the AI answers

Four questions every plant asks. Answered with proof.

How long has this machine got? Why is it degrading? What should we do? What if we change something? Ryedore answers each with an example you can read and a proof link you can follow — predictive maintenance, root cause and what‑if, in any industry with operational data.

Screenshot from the product — demonstration data
question → answer shape

Every answer has the same shape

A number with a range, the cause chain behind it, the recommended action (and the one to avoid), a confidence — and a link to how it was produced.

A plain‑Englishquestion1Number + range≈ 3 weeks (2–5)2Cause chainfan bank → less cooling→ oil ageing faster3Do / don’tdo: re‑tension nowdon’t: replace yet4Confidence87 %physics check passed5How it was madethe trace→ /verify/answer for “how long has CV‑12 got?” — a cement conveyor gearbox (illustrative)
Five parts, always: the number, the why, the do/don’t, how sure, and how to check. (Illustrative: a cement conveyor gearbox.)

swipe → to see the whole diagram

the four questions

One question, one worked example, one proof link — each

Examples are worked scenarios in the format every Ryedore answer takes. illustrative

  1. question 1

    How long has this machine got?

    A remaining‑life estimate with a range — and the trend behind it.

    Remaining‑life accuracy, signed on public data →
    for example · Cement · belt conveyor CV‑12 drive gearbox

    Vibration at the gearbox output shaft has climbed 38 % in 19 days; oil particle count is up. Remaining life ≈ 3 weeks (range 2–5). Plan the swap for the kiln shutdown in 16 days instead of an emergency stop.

  2. question 2

    Why is it degrading?

    The cause chain — not a correlation score — with the evidence for each link.

    See a full reasoning trace →
    for example · Utility · power transformer T‑7

    Top‑oil temperature +4 °C over three weeks at the same load. Chain: cooling‑fan bank #2 running at 60 % → reduced heat rejection → oil ageing accelerating. Cause is the fan controller, not the transformer.

  3. question 3

    What should we do — and what should we not do?

    A recommended action, the action to avoid, and the confidence — sent to a human for approval.

    How actions are gated →
    for example · Automotive · paint‑booth conveyor chain

    Chain elongation 1.9 % and accelerating. Do: re‑tension at the next shift change and inspect the drive sprocket. Don’t: replace the chain now — the sprocket wear pattern says it would elongate again in weeks.

  4. question 4

    What if we change something?

    A physics‑checked range for a plain‑English what‑if — and a controlled experiment when the stakes are high.

    How what‑if is checked →
    for example · Chemicals · distillation column C‑3

    “What if we raise the reflux ratio 5 %?” → distillate purity +0.4 pt, reboiler duty +6–8 %, flooding margin still ≥ 12 %. For a capital decision, the Specialists Lab runs baseline vs intervention on a physics twin.

the same answers, on the product

Three of the four answers, on the product’s own screens

Captured from the platform on demonstration data — the fourth, what-if, has its own page.

How long has it got? · Screenshot from the product — demonstration data. Click to enlarge.
Why is it degrading? · Screenshot from the product — demonstration data. Click to enlarge.
What should we do — ranked by cost and risk, not gut feel · Screenshot from the product — demonstration data. Click to enlarge.

The fourth answer on its own screen — What‑if Lab →

Not another dashboard. The answers on top of the ones you have.

Ryedore does not replace your monitoring platform, CMMS or historian.

It reads what they already collect and answers the four questions above — on your hardware.

three more detections

Setting, signal, why, response, outcome — in three more industries

Metals, pulp & paper, automotive. Same format as the detections on the home page; different plants. illustrative

DetectedWhyResponseOutcome
Hot rolling mill in a steel plant
Metals · rolling‑mill bearing
Metals →
Detected
Work‑roll bearing temperature trending +6 °C against a stable load; envelope vibration showing a repeating defect frequency.
Why
Inner‑race defect frequency emerging with side‑bands — the classic signature 3–4 weeks before spalling.
Response
Roll change advanced to the next scheduled stop; bearing sent for inspection.
Outcome
Spalling confirmed on inspection; no unplanned mill stop.
illustrative
Paper machine dryer section
Pulp & paper · dryer section
Pulp & Paper →
Detected
Steam‑to‑paper energy ratio drifting up 7 % over a fortnight; two dryer cans running cooler than their neighbours.
Why
Condensate not evacuating from cans 14 and 15 — syphon wear, not a steam‑supply problem.
Response
Syphon check scheduled at the next felt change instead of raising steam pressure.
Outcome
Ratio returned to baseline; avoided the energy penalty and a felt‑damaging pressure increase.
illustrative
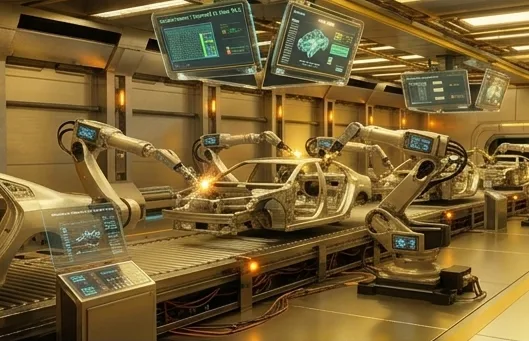
Painting robots on an automotive line
Automotive · paint‑shop robot
Automotive →
Detected
Robot R‑4 path‑repeatability error creeping from 0.3 mm to 0.7 mm; film‑build variance rising on the same panels.
Why
Wrist‑axis backlash — servo current signature matches gearbox wear, not calibration drift.
Response
Recalibration skipped; gearbox replaced at the weekend.
Outcome
Repeatability back to 0.3 mm; rework rate on those panels normalised.
illustrative
where it runs

On your data, on your hardware, on top of your monitoring

Historian, SCADA, CMMS, sensor gateways — Ryedore reads them where they are. Nothing leaves the site; the model learns from your labels inside your network.

Check the proof first: the signed bundle and open harness let you reproduce our numbers and run the same tests on your own data — yourself.

Run the audit yourself →
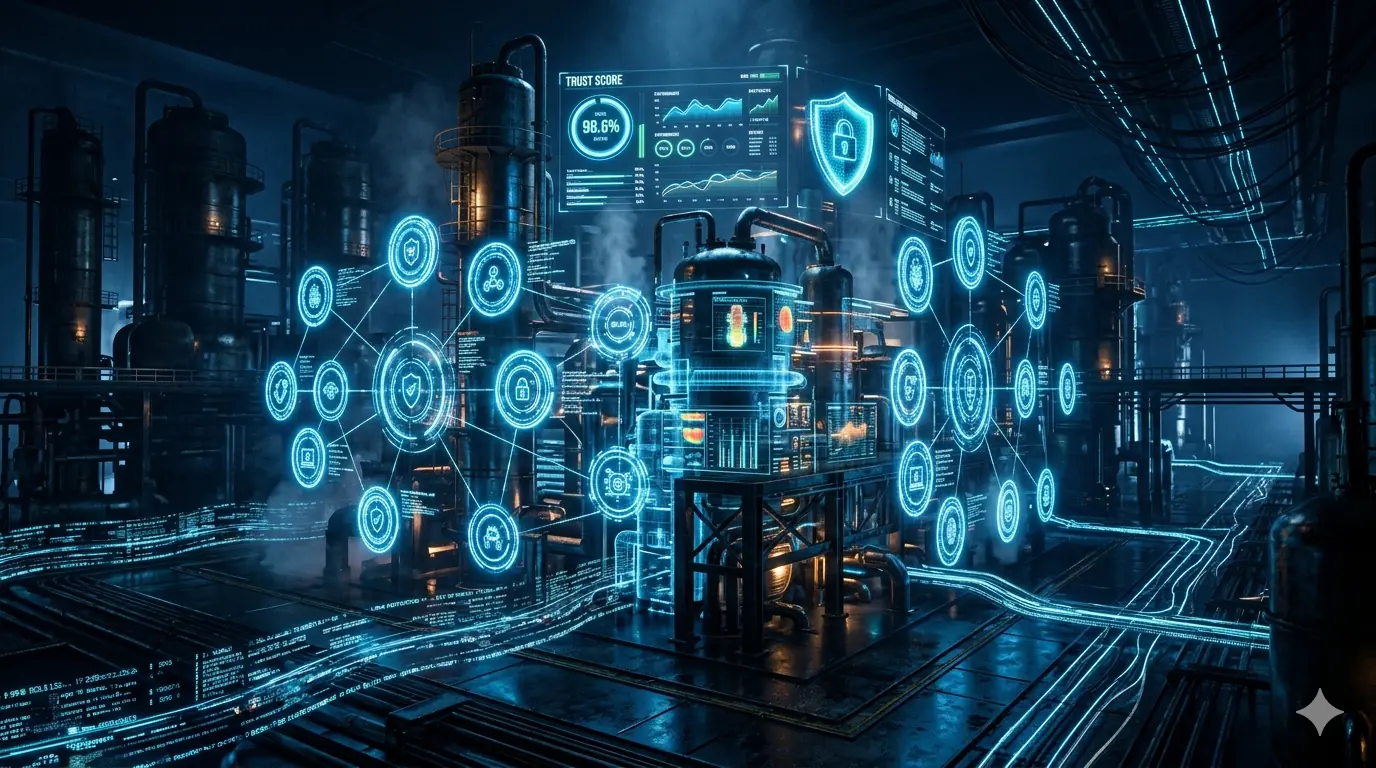
Sensor and control infrastructure inside a plant
questions plants ask first

Four answers

What data does it need from us?
What you already collect: historian, SCADA / PLC tags, CMMS work orders and, where you have them, sensor gateways — read‑only, inside your network. No new instrumentation is required to start; better labels sharpen it over time.
Does it replace our CMMS, historian or monitoring platform?
No. It sits on top of them and adds the four answers — remaining life, cause, action, what‑if — each with a trace. Your dashboards, thresholds and work‑order system stay exactly where they are.
Will it work on our kind of equipment?
It learns the failure pattern, not the sector — bearings, pumps, exchangers, transformers, presses, conveyors, reactors and more, across any industry with operational data. Aerospace, defence and nuclear run at a manual‑approval floor.
How do we know an answer is right before we act on it?
Every answer carries a confidence, a physics check and a reasoning trace you can open. Actions are proposals that pass six checks and a person. And the model behind it is benchmarked on public data, signed, and gated so it can never quietly get worse.
what the round builds here

Where it runs next

One program for where the answers run — at the edge, next to the controller. roadmap · not shipped

program 7

Edge inference next to the PLC; streaming anomaly that knows its own drift

today · measured
Signed sub‑10 ms on‑premises serving; a calibrated forecaster with 91 % conformal coverage; predictions served inside the customer boundary.
next
Quantised inference on hardware next to the controller; streaming conformal anomaly detection that recalibrates as the plant drifts; fleet‑level twins across sites.
proof point
Latency and coverage signed on edge hardware.

Funded by the growth round — what the round builds, all ten programs →

Bring one machine and one question.

We answer it live — remaining life, cause, action, or what‑if — with the trace.